How this guide was researched: This guide synthesizes publicly available market research, manufacturer specifications, and consumer feedback aggregated from verified buyer sources. Trusted Buyer Report has not personally tested the products mentioned. Data is cited and current as of May 2026.
We may earn a commission when you click links on this page. This doesn't affect our recommendations — our editorial assessment is completed before any affiliate link is applied. Full disclosure →
The Misconception Most Car Buyers Carry Into 2026
Most buyers entering the 2026 car market believe their biggest challenge is finding the right vehicle. It isn't. The real challenge is understanding how every decision you make — which vehicle you choose, how you finance it, what tires you put on it, and how you insure it — connects to every other decision, and how those connections quietly inflate your total ownership cost far beyond the sticker price.
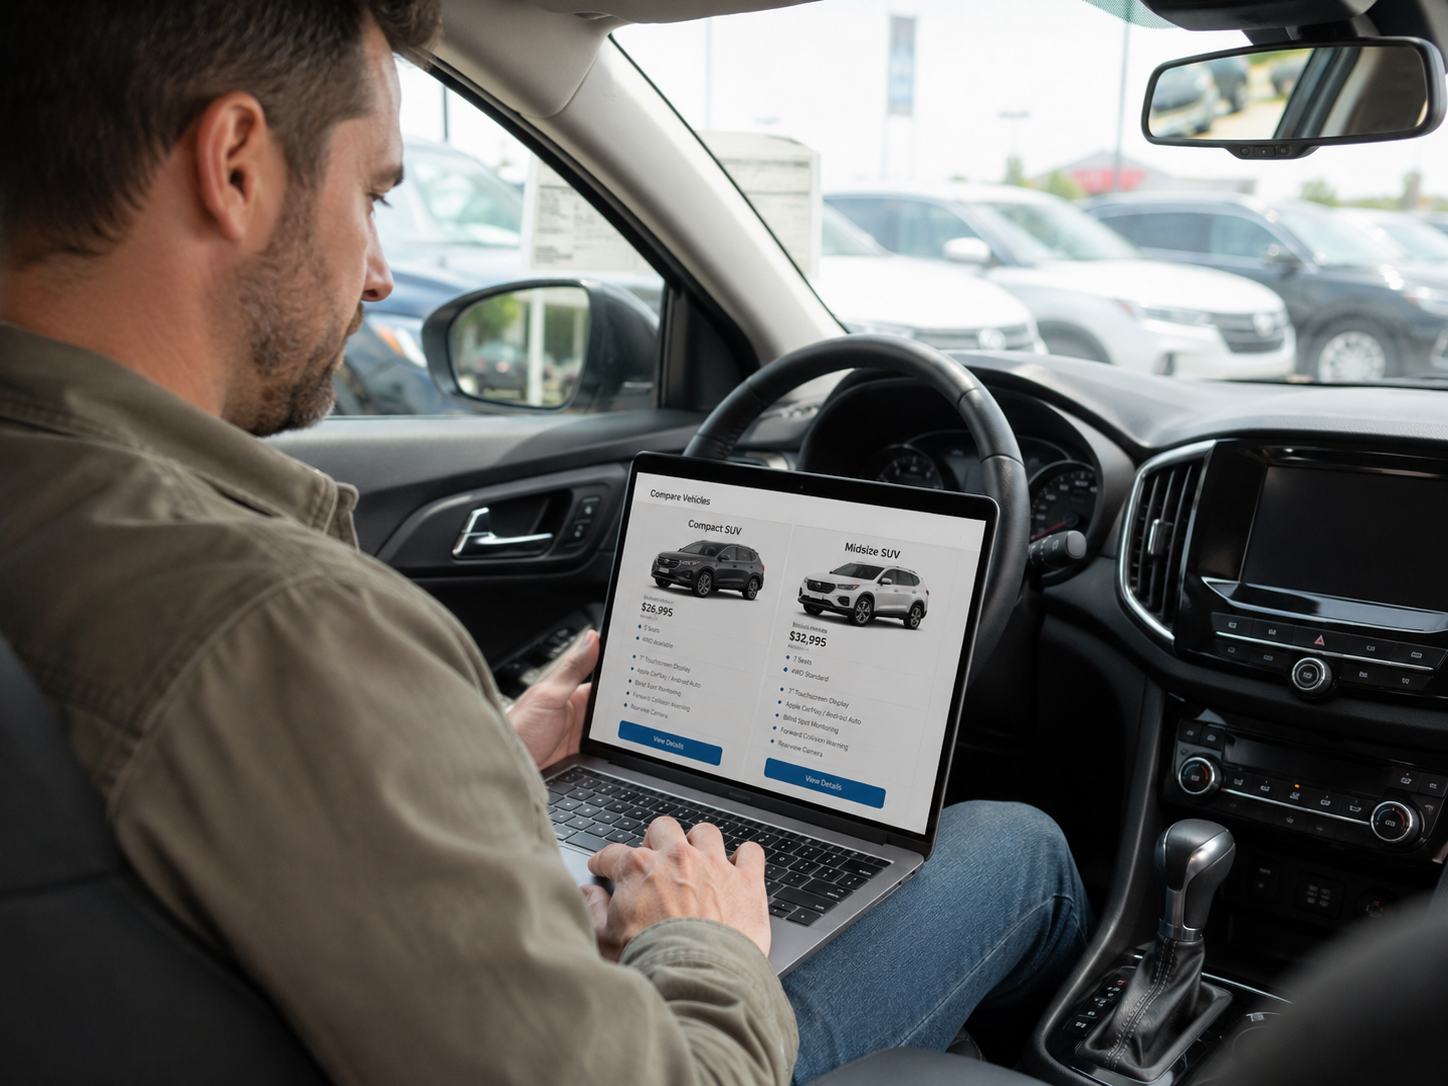
Consider this: a buyer who spends weeks researching vehicles using AI tools, arrives at a dealership confident and informed, and then discovers the average new car transaction price is over $48,000. The used car they considered as a fallback costs 49% more than it did in 2016. Their credit score — which they thought only affected their loan rate — also affects their insurance premium. And the extended loan term that makes the monthly payment manageable increases the risk of owing more than the car is worth for the first three years of ownership.
This guide addresses exactly that gap: not just what to buy, but how all the cost variables interact, and how to sequence your decisions to minimize total ownership cost — not just the number on the window sticker.
The 2026 Car Market in Plain Terms: What Buyers Are Actually Facing
The market entering 2026 is defined by a specific contradiction: buyers are better informed than ever, and yet the financial pressure of purchasing a vehicle has rarely been higher. According to Phyron's Car Buying Trends 2026 report, U.S. average new car transaction prices hovered around $48,326 in late 2025 — near record highs. That figure represents a vehicle category that was, for most of the previous decade, accessible to median-income households.
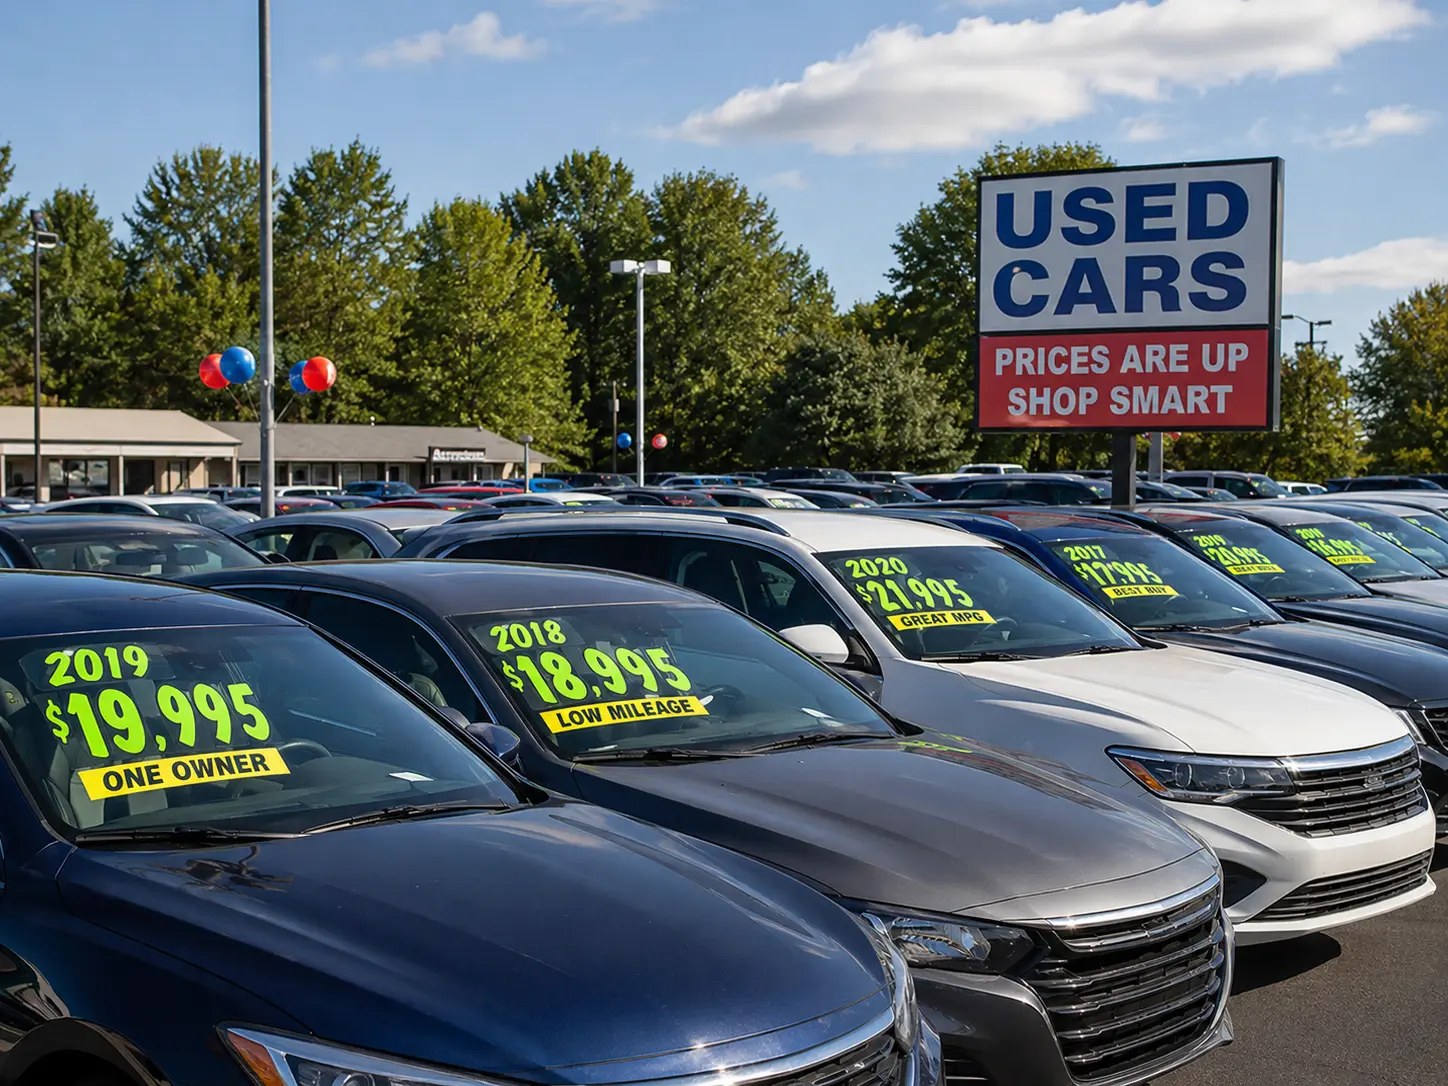
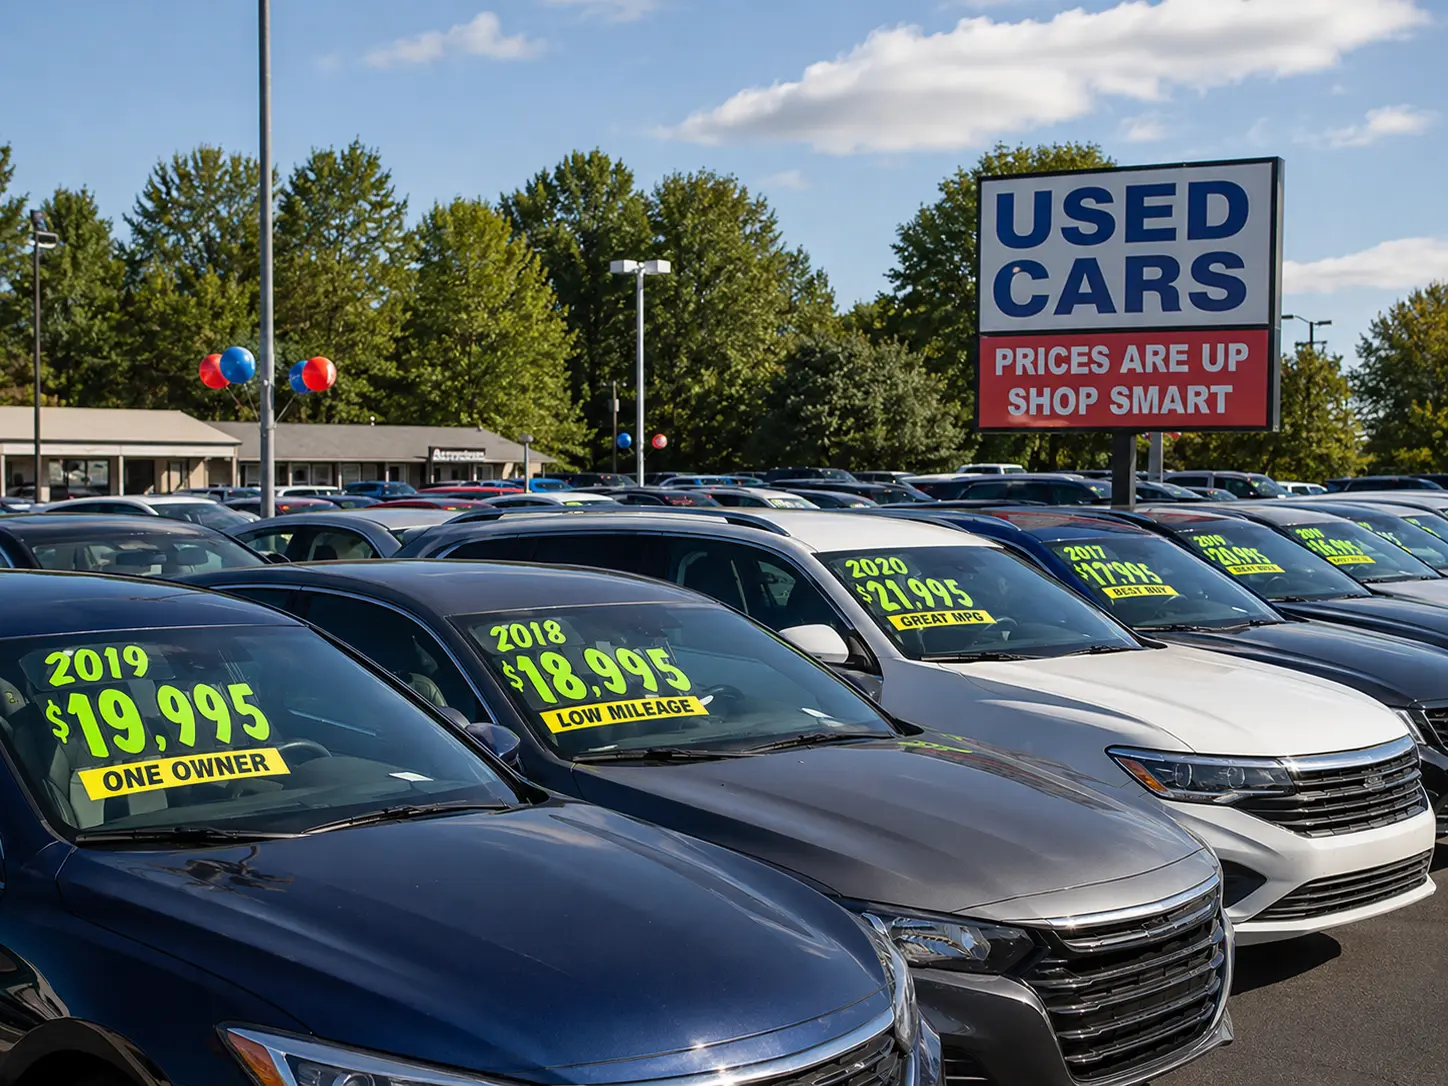
The used car market offers no simple relief. According to AutoInsurance.com's Guide to Buying a Used Car in 2026, used car prices have increased approximately 49% since 2016, rising from an average of $18,890 to roughly $28,710 by 2024. The surge between 2020 and 2022 — driven by semiconductor shortages, limited new vehicle production, and pandemic-era supply chain strain — pushed prices up 21% in 2021 alone. Prices stabilized around 2023 but have not meaningfully retreated.
Average Used Car Prices: 2016–2024
Year | Average Price | Year-Over-Year Change |
|---|---|---|
2016 | $18,890 | — |
2018 | $19,590 | +2.8% |
2020 | $20,030 | +4.5% |
2021 | $24,710 | +21% |
2022 | $28,740 | +15% |
2024 | $28,710 | +1.4% |
The market response is predictable: Bumper's 2026 Used Car Ownership Statistics study found that 76% of Americans who purchased a vehicle in 2026 bought used, primarily because new cars have become genuinely unaffordable for a large share of buyers. Meanwhile, the luxury segment is defying the broader slowdown — high-end sales remain strong while mid-market buyers hesitate or delay purchases entirely.
What $30,000 buys in 2026 depends entirely on which market you're shopping. In the new car market, $30,000 reaches the entry-level trim of compact SUVs like the Toyota Corolla Cross or Honda HR-V — vehicles with current warranties but limited features. In the used market, $30,000 can access a 2022–2023 midsize sedan or a 3-year-old compact SUV with under 40,000 miles — but with no manufacturer warranty, uncertain service history, and potentially higher loan rates.
New Car vs. Used Car in 2026: A Decision Framework, Not a Blanket Answer
The right answer depends on your credit profile, intended use, and risk tolerance — not a universal ranking of which option is "better." Here's how to think through it.
The Case for New
New vehicles come with full manufacturer warranties (typically 3 years/36,000 miles bumper-to-bumper, 5 years/60,000 miles powertrain), the latest active safety technology, and — in some cases — manufacturer financing incentives that can beat credit union rates. Depreciation is steep in year one (typically 15–20%), but for a buyer who plans to hold the vehicle for seven or more years, that initial loss matters less than long-term reliability.
The Case for Used
A certified pre-owned (CPO) vehicle at 2–3 years old has absorbed the steepest depreciation while often retaining a manufacturer-backed warranty extension. A 2022 Toyota Camry XSE, for example, might list at $24,000–$26,000 CPO versus $29,000+ for the base new model — with the used version offering a higher trim level for the same or lower price. The tradeoff is financing: used car loan rates are higher, and they vary significantly by credit score.
According to AutoInsurance.com, buyers with excellent credit (720+) access used car loan rates in the 5–7% range, while buyers with fair credit (580–669) may face rates of 12–18% or higher. On a $25,000 loan over 60 months, the difference between 6% and 15% APR is roughly $6,000 in total interest paid. That gap can erase the entire price advantage of buying used.
For reliability shortlisting, Consumer Reports' 2026 Automotive Brand Report Card is the most rigorous publicly available resource. CR gathered owner-reported data on approximately 380,000 vehicles spanning model years 2000–2025, covering up to 20 problem areas including engine, transmission, in-car electronics, and electric motors. Use it to eliminate models with poor predicted reliability before you even visit a lot — not after.
Experts at CarEdge recommend running a full 5-year total cost of ownership estimate before deciding, factoring in insurance, fuel, expected maintenance, and depreciation — not just the purchase price. That calculation frequently changes which option is actually cheaper.
How AI and Digital Tools Are Changing the Research Process
The 16th annual Car Buyer Journey Study from Cox Automotive, released January 13, 2026, found that AI-powered platforms and integrated retail solutions are driving record buyer satisfaction — the highest scores in the study's history. The research surveyed 2,300 consumers who purchased a vehicle in the previous 12 months. Satisfaction gains are being attributed to improved price transparency, personalized inventory matching, and streamlined financing pre-qualification.
That said, AI tools have real limitations you should understand before relying on them. C-4 Analytics' 2026 Auto Buyer Trends Report documents how buyer journeys have become increasingly fragmented — shoppers move across social media, manufacturer websites, third-party review platforms, and dealer sites, often receiving inconsistent information at each stop. AI tools trained on historical data may not reflect current regional inventory, live dealer incentives, or recent recall notices.
A practical research workflow that accounts for these gaps:
Initial shortlisting: Use AI tools and aggregator platforms (Cars.com, CarGurus, Edmunds) to identify 3–5 candidate models based on budget, size, and feature requirements.
Reliability validation: Cross-reference shortlisted models against Consumer Reports' 2026 Brand Report Card and NHTSA's recall database (nhtsa.gov) — both are free.
History verification: For any used vehicle, run a Carfax or AutoCheck report using the VIN before visiting the seller.
Price benchmarking: Use Edmunds' True Market Value or CarEdge's dealer invoice pricing tool to establish what the vehicle actually sells for in your region.
Human consultation: A pre-purchase inspection by an independent mechanic ($100–$200) remains the single highest-ROI step most buyers skip.
According to Phyron's 2026 car buying trends analysis, digital tools are changing everything — yet the human touch still matters. Buyers who combine digital research with direct expert consultation consistently report better purchase outcomes than those who rely on either channel alone.
Auto Parts in 2026: Quality Tiers, Supply Chain Reality, and What to Prioritize
Parts decisions affect both your repair budget and your insurance costs — and in 2026, the supply chain reality makes this more complicated than it was five years ago.
The Three Parts Tiers
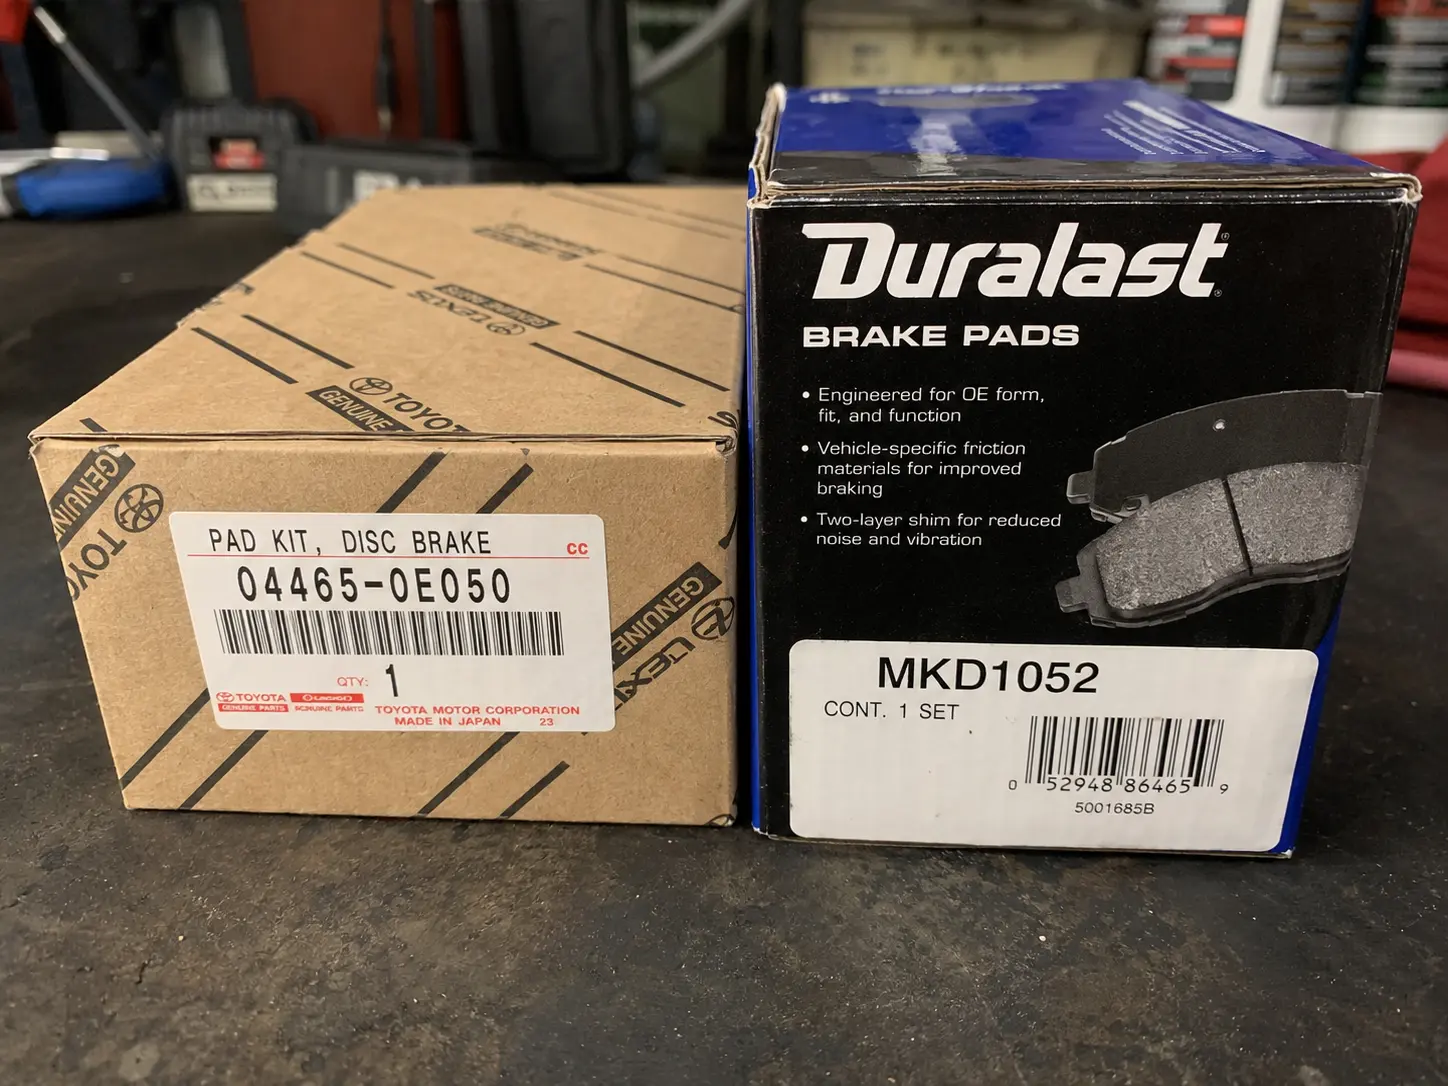
OEM (Original Equipment Manufacturer): Parts made by or to the exact specification of the vehicle manufacturer. Highest cost, guaranteed fit, typically required by manufacturer warranties. A set of OEM brake pads for a 2023 Honda CR-V runs $120–$180 per axle.
OEM-Equivalent Aftermarket: Parts made by third-party manufacturers to match OEM specifications. Brands like Bosch, Brembo, and Denso produce parts that meet or exceed OEM quality at 20–40% lower cost. These are appropriate for most routine repairs.
Remanufactured: Used parts rebuilt to factory specifications — common for alternators, starters, and brake calipers. Lower cost, but quality varies by supplier. Look for AAIA-certified remanufacturers.
The supply chain issue that matters most in 2026 is cycle time. According to the American Agents Alliance's 2026 Insurance Trends analysis, supply chain challenges and labor shortages have increased both parts costs and repair cycle times — particularly for sensor-based components in modern vehicles. A rear parking sensor replacement on a 2022–2024 model that previously took 2–3 days may now take 1–2 weeks due to parts availability. That gap means more rental car days, which is a cost most buyers don't budget for.
Smart vehicles and EVs compound this problem. The American Agents Alliance report specifically notes that smart vehicles contain expensive sensor arrays and driver-assist components that are significantly more complex and costly to install than traditional parts. A forward collision radar module replacement on a 2023 Ford F-150 can run $1,500–$2,500 in parts alone, before labor.
Before buying any used vehicle, ask these five questions about parts:
Are there any open recalls on this VIN? (Check nhtsa.gov — free, takes 30 seconds)
What is the parts availability status for this model's known failure points?
Does this vehicle use proprietary dealer-only calibration for safety systems after repair?
What is the average repair cost for this model's most common issues? (RepairPal provides model-specific estimates)
Is this model's parts supply affected by ongoing chip shortage legacy issues?
Tire Buying Guide for 2026: Matching Tires to Your Vehicle, Climate, and Budget
Tires are the single point of contact between your vehicle and the road, yet most buyer's guides treat them as an afterthought. In 2026, with EV adoption increasing and regional climate variability affecting driving conditions, tire selection deserves deliberate attention.
Understanding Tire Categories
All-Season: Designed for year-round use in mild climates. Handles light snow but not optimized for sustained winter conditions. Appropriate for most buyers in the southern and coastal U.S.
All-Weather: A step above all-season — carries the Three-Peak Mountain Snowflake (3PMSF) rating, meaning it meets minimum snow traction standards. Suitable for buyers in the Upper Midwest or Northeast who want one set of tires year-round.
Winter/Snow: Dedicated winter tires (e.g., Michelin X-Ice Snow, Bridgestone Blizzak WS90) deliver significantly better braking and cornering in temperatures below 45°F. Requires seasonal swapping but outperforms all-weather tires in genuine winter conditions.
Summer Performance: Optimized for dry and wet grip at higher temperatures. Stiffens and loses traction below 45°F — not appropriate for year-round use in cold climates.
All-Terrain: Designed for light off-road use. Louder on pavement, lower fuel efficiency, but appropriate for buyers who regularly drive on unpaved roads.
Reading the Sidewall
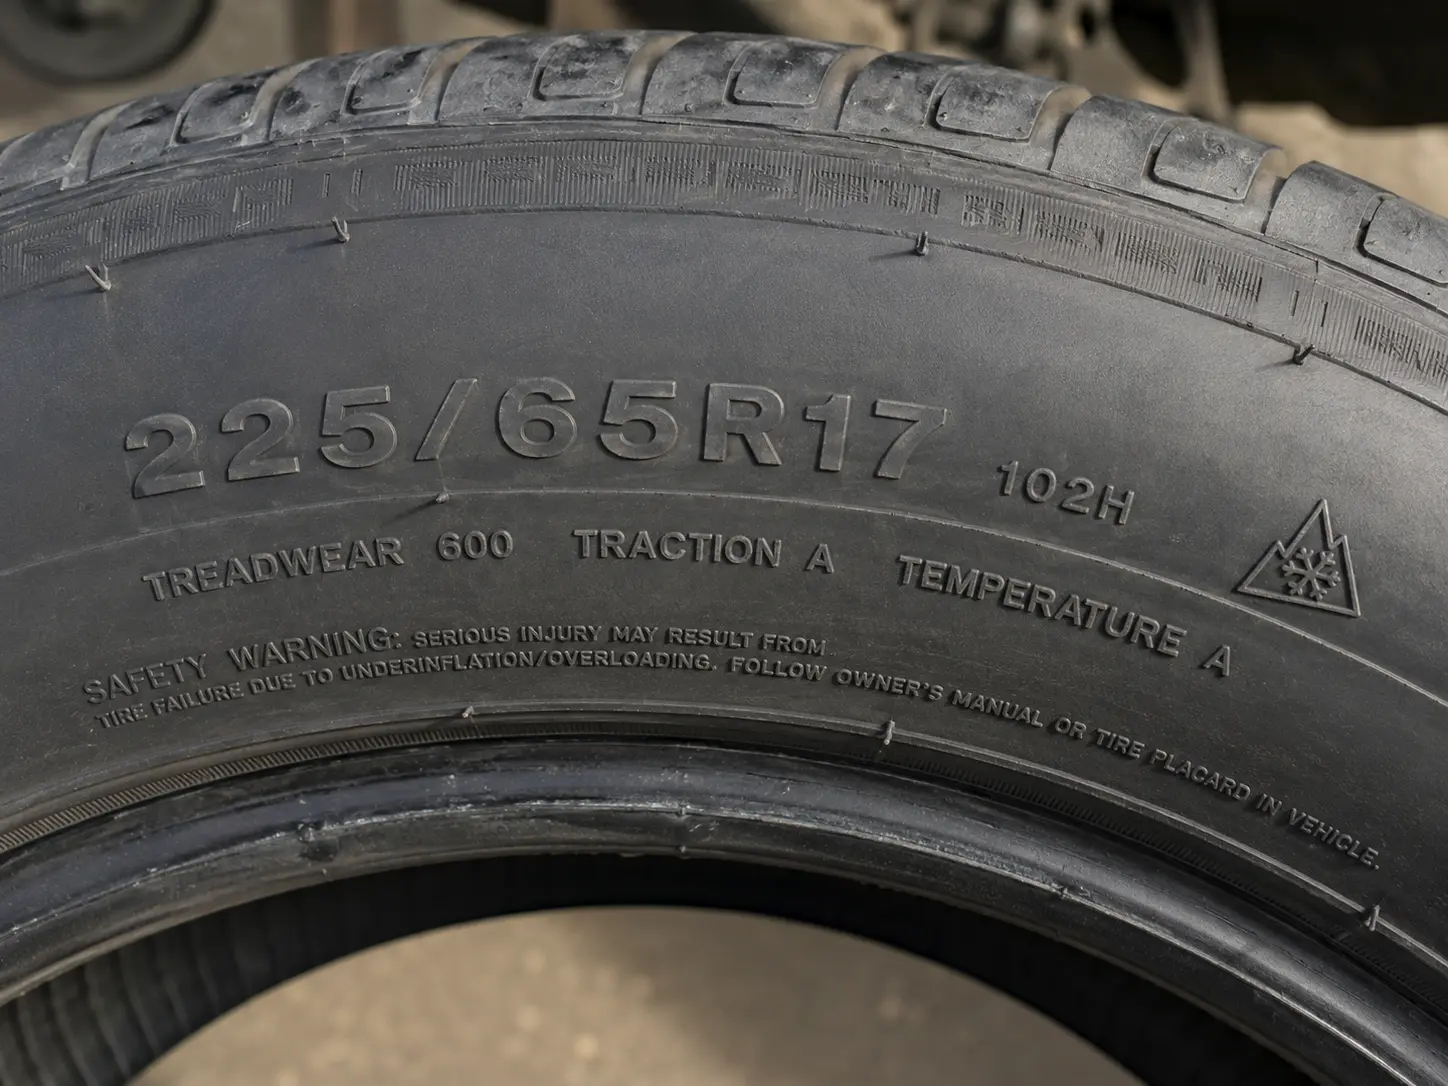
A tire marked 225/65R17 tells you: 225mm tread width, 65% aspect ratio (sidewall height is 65% of tread width), R for radial construction, 17-inch rim diameter. Your vehicle's correct tire size is on a sticker inside the driver's door jamb — always start there, not with what was on the car when you bought it.
Total Tire Cost
The purchase price is only part of the cost. Budget for installation ($15–$25 per tire), balancing ($10–$15 per tire), an alignment check ($80–$120), and disposal fees ($3–$5 per tire). A set of four mid-range all-season tires priced at $130 each carries a realistic total installed cost of $580–$650.
For Upper Midwest buyers choosing between all-weather and dedicated winter tires: dedicated winters cost more upfront (a set of Blizzak WS90s runs $160–$200 each) but extend the life of your summer or all-season set. Over three years, the total cost difference is often less than $200 — while the safety margin in ice and snow is substantial.
EV Tire Considerations
Electric vehicles wear tires 20–30% faster than equivalent ICE vehicles due to higher torque delivery and greater vehicle weight. Standard tires also underperform on EVs because they aren't rated for the load. Look for tires carrying an EV-specific designation (Michelin's "e" series, Continental's EV-rated lineup) or verify the load index matches your vehicle's gross weight. Budget for more frequent replacement — every 25,000–35,000 miles rather than the 40,000–50,000 miles typical for ICE vehicles.
The penny/quarter tread depth test: Insert a penny into the tread groove with Lincoln's head facing down. If you can see the top of Lincoln's head, tread depth is below 2/32" — replace immediately. A quarter gives you earlier warning: if Washington's head is visible, you're at 4/32" and should start planning replacement.
Auto Insurance in 2026: What's Driving Rates Up and How to Evaluate Coverage
Insurance premiums have risen significantly entering 2026, and the reasons are structural — not temporary. According to the American Agents Alliance's 2026 insurance trends report, five compounding factors are pushing rates higher: rising repair and replacement costs, longer repair cycle times, expensive smart vehicle sensor components, increased accident frequency from distracted driving, and rising medical costs affecting severity even in minor accidents.
How Your Credit Score Affects Insurance Premiums
In most U.S. states, insurers use a credit-based insurance score as a rating factor. A buyer with a credit score in the 580–669 range may pay 40–60% more annually for the same coverage than a buyer with a 720+ score — on the same vehicle, in the same zip code. Combined with the higher loan APR that lower credit scores also produce, the compounding effect on total ownership cost is significant. A buyer moving from a 650 to a 720 credit score before purchasing could save $1,500–$3,000 over a five-year loan period across both interest and insurance costs.
Coverage Types Explained
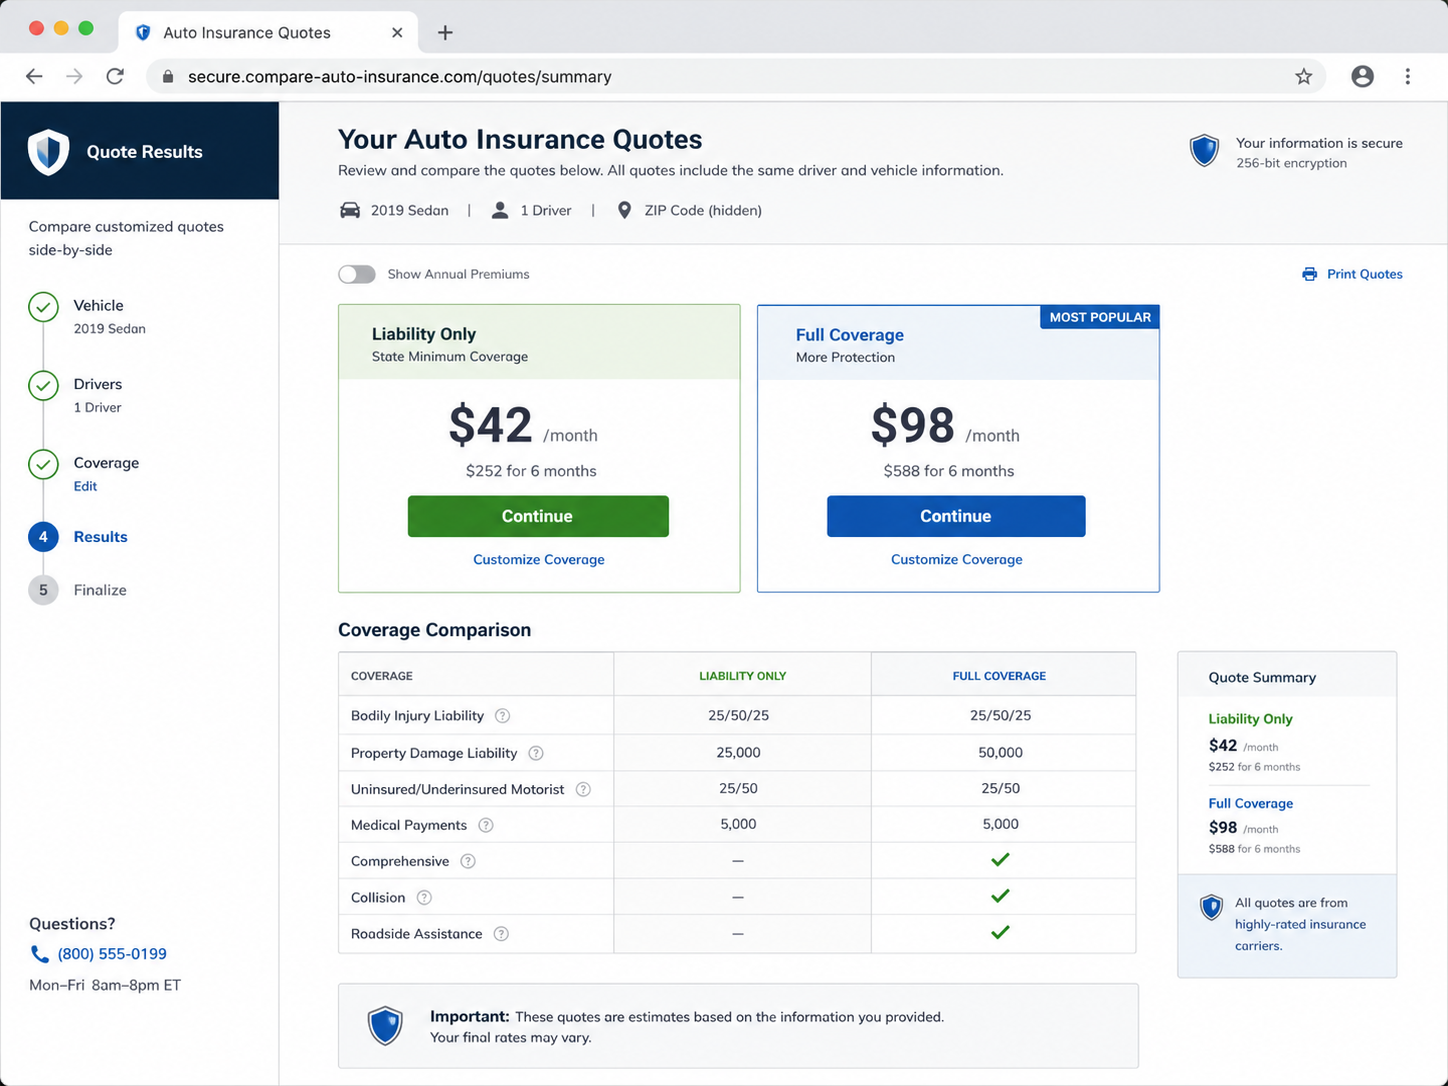
Liability: Covers damage and injury you cause to others. Required in almost every state. State minimums are often inadequate — consider at least 100/300/100 limits.
Collision: Covers damage to your vehicle from a collision, regardless of fault. Required by most lenders.
Comprehensive: Covers non-collision damage — theft, weather, animals. Also required by most lenders.
Uninsured/Underinsured Motorist: Covers you when the at-fault driver has no insurance or insufficient coverage. Particularly important given rising uninsured driver rates.
Gap Insurance: Covers the difference between what your car is worth and what you owe on the loan if the vehicle is totaled. In 2026, with high vehicle prices and long loan terms common, gap insurance is more relevant than it has been in years. Example: you finance a $35,000 vehicle, carry it for 18 months, and it's totaled. Standard comprehensive coverage pays the current market value — perhaps $28,000. If you owe $31,000, gap insurance covers the $3,000 difference.
Climate volatility is also reshaping insurance availability regionally. According to the American Agents Alliance, carriers are updating catastrophe models and redefining capacity in disaster-prone regions, pushing more business to regional carriers and startups. If you're purchasing a vehicle in Florida, California, or coastal Texas, verify carrier availability and financial stability (AM Best rating of A- or better) before assuming standard coverage options apply.
Financing Your Vehicle in 2026: Avoiding the Total Cost Trap
The most common financing mistake buyers make is optimizing for monthly payment rather than total cost. A $25,000 loan at 7% APR over 48 months costs $3,155 in total interest. The same loan over 72 months costs $5,761 — $2,606 more, for the privilege of a lower monthly payment. Extend that to an 84-month term, and you pay $7,587 in interest while spending the first two years of the loan nearly underwater on the vehicle's value.
According to Phyron's 2026 car buying trends data, 72- and 84-month loans are increasingly common as buyers stretch to afford vehicles near the $48,326 average transaction price. The risk is negative equity: if you need to sell or trade the vehicle before the loan is paid off, you may owe more than it's worth.
Get pre-approved before you visit a dealer. A pre-approval from your bank or credit union gives you a concrete benchmark rate and removes the dealer's ability to use financing as a negotiating variable. Dealer financing can sometimes beat bank rates — manufacturers occasionally offer 0% or low-APR promotions — but only compare it against your benchmark with the full contract in front of you, including any fees rolled into the APR.
APR and interest rate are not the same figure. APR (Annual Percentage Rate) includes fees and gives a more accurate total cost comparison across loan offers. Always compare APR, not just the stated interest rate.
Reliability Research: How to Use Consumer Reports and Owner Data Effectively
Reliability data is only useful if you know how to read it correctly — and most buyers don't. The most common mistake is treating a brand's overall ranking as a proxy for a specific model's reliability. It isn't.
Here's what the data actually tells you:
Consumer Reports' 2026 Brand Report Card gathered owner-reported data from approximately 380,000 vehicles spanning model years 2000–2025, covering up to 20 problem areas per vehicle. A brand's overall score is an average across its entire lineup — which means a manufacturer with one highly reliable compact car and one problematic large SUV will produce a middling brand score that tells you nothing useful about either specific model.
Use CR at the model level, not the brand level. Before shortlisting any vehicle, look up that specific model's reliability history for the model years you're considering. Pay particular attention to any redesign years — when a manufacturer launches a new generation of a model, the first two model years frequently show elevated problem rates as manufacturing processes stabilize. The 2023–2024 model years of several popular SUVs, for example, show meaningfully higher in-car electronics complaints than the 2025 versions of the same vehicles. A one-year-newer used vehicle can be significantly more reliable than a marginally older one.
Owner forums are underrated secondary sources. After checking CR, look up model-specific forums and owner communities for the vehicles on your shortlist. Forum discussions surface failure modes that owner surveys don't capture at scale — a recurring transfer case issue, a known HVAC compressor failure at high mileage, or a software bug that triggers false warning lights. These are not reasons to automatically eliminate a vehicle, but they help you ask the right questions during a pre-purchase inspection and budget for known future maintenance.
NHTSA's complaint database (nhtsa.gov) is free and searchable by model year and problem category. It documents owner-reported safety complaints, investigation records, and recall history. A recall that has already been remedied is not a disqualifier — but an open recall on the specific VIN you're considering is. Check nhtsa.gov with the vehicle's VIN before finalizing any used car purchase. This takes under two minutes.
RepairPal's cost estimator provides model-specific repair cost ranges for common maintenance and repair items. Before purchasing any vehicle, look up the estimated cost of its three or four most frequently needed repairs — brake pad replacement, timing belt/chain service (if applicable), transmission fluid service, and any known model-specific issues you identified from forum research. A vehicle with an estimated $800 brake service versus $350 for a comparable alternative represents a meaningful 5-year cost difference that doesn't appear anywhere in the purchase price.
One pattern worth noting across reliability data sources: in-car electronics and driver-assist systems now represent the fastest-growing category of owner complaints, particularly in 2022–2024 model years across multiple brands. These systems are expensive to diagnose and repair, often require dealer-only calibration, and are not always covered by extended warranties at the component level. If technology integration is a high priority for you, weigh the reliability track record of a specific model's electronics against its other merits before committing.
How to Negotiate in 2026: What Actually Works, and What Dealers Expect
Most buyers dread negotiating. Most dealers expect it. The gap between those two positions is where buyers leave money on the table.
The core principle: negotiate price, not payment. Dealers are highly skilled at reframing a $3,000 negotiation into a $47/month discussion — which sounds smaller, hides the true cost, and prevents you from making a clean comparison across vehicles. Always discuss and agree on the out-the-door price (total price including all fees, taxes, and add-ons) before any financing conversation begins.
What to know before you walk in:
Your pre-approved financing rate (so dealer financing is compared against a known benchmark)
The vehicle's True Market Value or invoice price from Edmunds or CarEdge
The specific trim and options you want (so the conversation can't drift toward a different, higher-margin vehicle)
Any open incentives or rebates the manufacturer is currently offering (check the manufacturer's website directly)
Dealer add-ons are where significant margin is recaptured. After agreeing on vehicle price, the finance and insurance (F&I) office will present a menu of add-ons: extended warranty, paint protection, fabric protection, window tinting, nitrogen tire fill, and similar items. Most of these are high-margin products that you can decline or purchase elsewhere later at lower cost. Extended warranties from reputable third parties are an exception — if you want one, shop it separately before the F&I meeting so you know what a fair price looks like.
The end of the month and end of the quarter are genuinely better times to negotiate. Dealer sales targets are monthly and quarterly — a salesperson who needs two more units to hit a bonus tier in the last week of June is in a different position than the same salesperson in the first week of July. This isn't folklore; it's a structural incentive that creates real negotiating leverage.
On EVs specifically: Federal tax credit eligibility under the Inflation Reduction Act depends on both the vehicle and the buyer's income. As of 2026, qualifying buyers can apply up to $7,500 in point-of-sale EV credits at the dealer — but the vehicle must meet domestic assembly and battery component requirements, and the buyer's income must fall within adjusted gross income limits ($150,000 for single filers, $300,000 for joint filers). Verify current eligibility using the IRS's online tool before the purchase conversation, not after — credit availability can change with model year transitions.
Total Cost of Ownership: The Number That Actually Matters
Sticker price is the least useful number in a car-buying decision. Total cost of ownership (TCO) over your intended holding period is the number that determines whether a purchase was financially sound.
A five-year TCO estimate for any vehicle should include:
Cost Category | What to Estimate |
|---|---|
Purchase price (net) | After trade-in, down payment, and any incentives/rebates |
Financing cost | Total interest paid over the loan term |
Depreciation | Expected value at the end of your holding period |
Insurance premiums | Annual premium × years owned |
Fuel / charging cost | Annual miles ÷ MPG (or MPGe for EVs) × fuel cost per gallon/kWh |
Scheduled maintenance | Oil changes, tire rotations, brake service, timing service |
Tires | Replacement frequency × cost per set |
Unexpected repairs | Use RepairPal model average as a baseline estimate |
Registration / taxes | Varies by state; factor in annual renewal costs |
Running this calculation for your top two or three candidates often produces counterintuitive results. A vehicle with a $4,000 lower purchase price may have a higher five-year TCO than a pricier alternative because of higher insurance rates, lower fuel efficiency, or known reliability issues that drive repair costs. Conversely, an EV with a higher sticker price frequently shows a lower five-year TCO than a comparable ICE vehicle once fuel savings, reduced maintenance costs (no oil changes, fewer brake replacements due to regenerative braking), and incentives are factored in.
The depreciation calculation matters more than most buyers realize. A vehicle that holds 55% of its value after five years versus one that holds 35% represents a $5,000+ difference on a $25,000 vehicle — a figure that dwarfs most negotiating wins on purchase price. Toyota, Honda, and Subaru models consistently rank highest for retained value. Luxury brands and domestic trucks depreciate more aggressively in the current market, with some exceptions in the full-size pickup category where supply constraints have kept used values elevated.
Tools that automate this calculation: CarEdge's TCO estimator and Edmunds' True Cost to Own tool — both free and model-specific.
Your Pre-Purchase Checklist: 10 Steps Before You Sign
Use this sequence regardless of whether you're buying new or used:
Set your all-in budget — not just the monthly payment, but the total financed amount, down payment available, and maximum TCO over your holding period.
Check and, if possible, improve your credit score before applying for financing. Even a 20-point improvement in the 640–680 range can shift you into a meaningfully lower rate tier.
Get pre-approved for financing from your bank or credit union before visiting any dealership.
Shortlist 3–5 models using aggregator platforms (Edmunds, CarGurus, Cars.com) based on size, budget, and feature requirements.
Check each shortlisted model's reliability at the model-year level using Consumer Reports, NHTSA complaints, and model-specific owner forums.
Run a 5-year TCO estimate for your top two candidates using CarEdge or Edmunds' tools. Compare total cost, not sticker price.
For any used vehicle: pull a Carfax or AutoCheck report using the VIN. Check nhtsa.gov for open recalls. Never skip this step.
Schedule a pre-purchase inspection by an independent mechanic before finalizing a used vehicle purchase. Budget $100–$200. The return on this investment is asymmetric — it either confirms your purchase or prevents a costly mistake.
Negotiate the out-the-door price first, before any financing discussion. Get the total in writing.
Review the F&I menu items before the finance office meeting. Decide in advance what you want and what you'll decline, based on prices you've researched separately.
Frequently Asked Questions
Should I buy new or used in 2026? Neither is universally better — it depends on your credit score, intended holding period, and risk tolerance. A buyer with a 720+ credit score who plans to hold a vehicle seven or more years often comes out ahead buying new with a manufacturer warranty, especially if manufacturer financing incentives are available. A buyer with fair credit who wants to minimize monthly outlay may find a 3-year-old CPO vehicle hits a better price point — but should run the full TCO calculation to verify, because higher loan rates on used vehicles can erode the price advantage significantly.
How much does a credit score actually affect my car-buying costs? More than most buyers expect. The combined impact on loan rate and insurance premium can add up to $3,000–$5,000 over a five-year ownership period for a buyer in the fair credit range (580–669) compared to excellent credit (720+). If your purchase isn't urgent and your score is in the 660–700 range, three to six months of credit improvement work before buying is worth quantifying against the cost of buying now.
Are extended warranties worth buying? For vehicles with known reliability issues in the model year you're considering, a third-party extended warranty from a reputable provider (Endurance, CARCHEX, or manufacturer-backed CPO extensions) can provide meaningful protection. For vehicles with strong Consumer Reports reliability ratings, extended warranties are often low expected-value purchases. The key variable is whether the vehicle's known failure modes — particularly in-car electronics and driver-assist systems in 2022–2024 model years — are covered by the specific warranty contract. Read the exclusions carefully before purchasing.
What's the single most important thing I can do before buying a used car? A pre-purchase inspection by an independent mechanic. It's the step most buyers skip because it feels redundant after reading the Carfax report — but Carfax documents history, not current condition. A mechanic can identify deferred maintenance, hidden rust, unreported accident damage, and early-stage mechanical issues that the vehicle history report won't show. At $100–$200, it's the highest-ROI step available and the one most consistently associated with avoiding costly surprises.
Is gap insurance worth it in 2026? More so than in prior years. With average new car transaction prices above $48,000 and 72- to 84-month loan terms increasingly common, the window of negative equity is longer than it has historically been. If you're financing more than 80% of the vehicle's value on a term longer than 60 months, gap coverage is worth the cost. Get it through your auto insurer rather than at the dealership — dealer-sold gap coverage is typically two to three times the price of the equivalent product through an insurer.
How do I compare tire brands without getting overwhelmed? Start with the category your climate and driving pattern require. Within the correct category, use UTQG (Uniform Tire Quality Grade) ratings as an objective comparison tool: the treadwear number indicates relative longevity, traction grade (AA, A, B, C) indicates wet stopping ability, and temperature grade (A, B, C) indicates heat resistance. Then narrow further using tirerack.com's user reviews and independent test results from Consumer Reports or European tire test organizations (ADAC, TCS), which run standardized braking and handling tests across tire categories annually.
What to Do Next
This guide covers the decisions that compound into your total ownership cost — not just the ones that appear on the window sticker. The sequence matters: credit score before financing, financing before dealership, reliability research before the lot, inspection before the signature.
The most expensive car-buying mistakes in 2026 aren't from choosing the wrong vehicle. They're from not knowing how each decision affects the others until the contract is signed.
Useful resources referenced in this guide:
NHTSA Recall Search — free VIN lookup
RepairPal Cost Estimator — model-specific repair cost ranges
CarEdge TCO Calculator — five-year total cost of ownership by model
Edmunds True Cost to Own — comparable TCO tool
Tirerack.com — tire comparison, reviews, and independent test results